Introduction to DFT and Fourier phase space for music analysis
Follows exposition in Jason Yust, “Schubert’s Harmonic Language and Fourier Phase Space.” Journal of Music Theory. 59/1 (2015)
Import some modules and functions that will be useful later.
import itertools
import music21

import numpy as np
from matplotlib import pyplot as plt

from numpy.fft import fft
%matplotlib inline
The Fourier transform decomposes a time-varying signal into a mixture of sinusoidal components.
To take advantage of the Fourier transform, we represent a pitch class (multi)set as a pitch-class vector, where the n-th entry in the vector correpsonds to the cardinality of the pc n in the multiset.
C_major_triad = [1, 0, 0, 0, 1, 0, 0, 1, 0, 0, 0, 0]
We can treat the sequence of integers as a a “peaky” time-varying signal, and get its Fourier decomposition immediately thanks to numpy and friends.
decomp = fft(C_major_triad)
decomp
array([  3.00000000e+00 +0.00000000e+00j,
        -3.66025404e-01 -3.66025404e-01j,
         1.00000000e+00 -7.77156117e-16j,
         2.00000000e+00 +1.00000000e+00j,
        -6.66133815e-16 -1.73205081e+00j,
         1.36602540e+00 +1.36602540e+00j,
         1.00000000e+00 +0.00000000e+00j,
         1.36602540e+00 -1.36602540e+00j,
         1.44328993e-15 +1.73205081e+00j,
         2.00000000e+00 -1.00000000e+00j,
         1.00000000e+00 -4.44089210e-16j,  -3.66025404e-01 +3.66025404e-01j])
Nice. Each of these components are represented as a complex number (thanks numpy). What’s the deal here? I thought that Fourier decomposition had something to do with sines and cosines. Well, it does. These components conveniently summarize the magnitude and the phase of the contribution of each component. Each component here is represented in Cartesian coordinate form; a little trig - or the use of numpy builtins - gets us the polar form, where the radius is the magnitude of the contribution and the angle ($\varphi$) is its phase (in radians).
magnitudes = np.absolute(decomp)
phases = np.angle(decomp)
list(zip(magnitudes, phases))
[(3.0, 0.0),
 (0.51763809020504126, -2.3561944901923453),
 (0.99999999999999856, -7.7715611723761066e-16),
 (2.2360679774997898, 0.46364760900080609),
 (1.7320508075688776, -1.570796326794897),
 (1.9318516525781366, 0.7853981633974475),
 (1.0, 0.0),
 (1.9318516525781373, -0.78539816339744872),
 (1.732050807568879, 1.5707963267948959),
 (2.2360679774997898, -0.46364760900080609),
 (1.0000000000000007, -4.4408920985006232e-16),
 (0.5176380902050437, 2.3561944901923439)]
The magnitude of the zeroth fourier component is the same as the cardinality of the pitch-class (multi)set.
assert np.absolute(decomp)[0] == sum(C_major_triad)
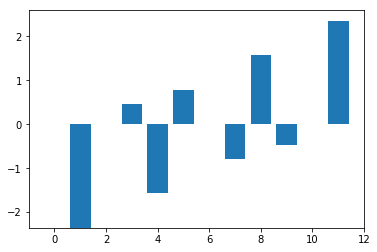
The magnitude and phase of the remaining components are related to each other (because real-values?). Can you see how?
plt.bar(range(len(phases)), phases)
plt.show()
plt.bar(range(len(magnitudes)), magnitudes)
plt.show()
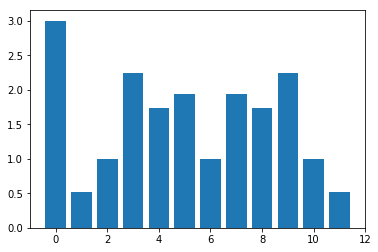
So we are really only interested in the phase and magnitude of components 1 through 6. We can reconstruct the other components from these, if need be, but this symmetry is always going to hold so we don’t have to worry.
I’m not really in the mood for figuring out the pitch class vector for every collection I dream up, so I wrote some functions to help. strchord_to_char() takes a human-readable string and, with the help of music21, converts it to the vector form.
def c_to_char(c):
    char = []
    pcs = c.pitchClasses
    for i in range(12):
        if i in pcs:
            char.append(1)
        else:
            char.append(0)
    return char

def strchord_to_char(strchord):
    c = music21.chord.Chord(strchord)
    return c_to_char(c)
strchord_to_char('B- D- F A-')
[0, 1, 0, 0, 0, 1, 0, 0, 1, 0, 1, 0]
I also wrote a function that returns all the distinct transpositions of a vector representation of a pcset.
def transpose_char_to_all(char):
    def rotate(l, n):
        return l[-n:] + l[:-n]

    transposed = []
    for i in range(12):
        transposed.append(rotate(char, i))

    transposed.sort()
    filtered = list(k for k,_ in itertools.groupby(transposed))
    return filtered
There should be tweleve distinct transpositions of the major triad, but only four of the augmented triad.
assert len(transpose_char_to_all(strchord_to_char('C E G'))) == 12
assert len(transpose_char_to_all(strchord_to_char('C E G#'))) == 4
Phase space
Phase is what Yust is most interested in. It tells something about the location of the set in tonal space. Magnitude of components is transposition invariant; phase is not. He is especially interested in the spatial interpretation of these values. We can pick any pair of components and look at the position of pcsets in the 2D space induced by this choice
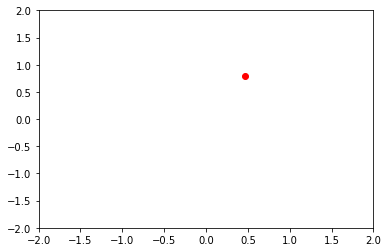
Let’s look at the phases of components 3 and 5 for the C major triad
plt.scatter(x=phases[3], y=phases[5], c='r')
plt.xlim(-2, 2)
plt.ylim(-2, 2)

plt.show()
Having done so, we want to know what are the interesting phase spaces and what are the disinteresting ones, given the harmonic materials we are interested in talking about.
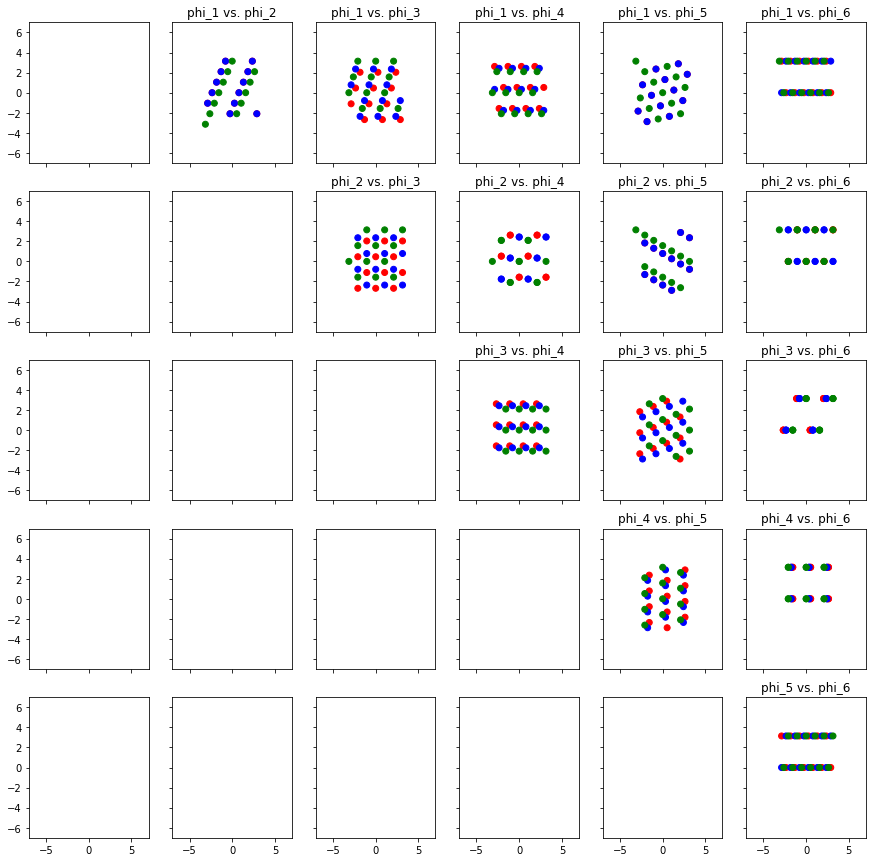
Let’s write a function that takes a list of characteristic representations of pcsets and plots all the pcsets in all the Fourier phase spaces
def plot_in_all_phase_spaces(pcsets, phase_scope=[1, 2, 3, 4, 5, 6], c='b'):
    spaces = list(itertools.combinations(phase_scope,2))

    fig, axarr = plt.subplots(5, 6, sharex=True, sharey=True)

    plt.xlim(-7, 7)
    plt.ylim(-7, 7)


    for space in spaces:
        xs = []
        ys = []

        x, y = space

        for pcset in pcsets:
            decomp = fft(pcset)
            phases = np.angle(decomp)
            xs.append(phases[x])
            ys.append(phases[y])

        axarr[x - 1, y - 1].scatter(xs, ys, c=c)
        axarr[x - 1, y - 1].set_title('phi_{} vs. phi_{}'.format(x, y))
interesting = transpose_char_to_all(strchord_to_char('C E G')) + transpose_char_to_all(strchord_to_char('C E G B-')) + transpose_char_to_all(strchord_to_char('C D E F G A B'))
Make the major triads red, the dominant sevenths blue, and the major scale green.
colors = ['r'] * 12 + ['b'] * 12 + ['g'] * 12
plt.rcParams['figure.figsize'] = (15, 15)
plot_in_all_phase_spaces(interesting, c=colors)
Recall the bar plots above that show the phase and magnitude of each of the components. What if the magnitude of a component is zero? Then the phase is undefined. It doesn’t make that much sense to work with phase space plots where the phase is undefined.
Let’s write some code that will reveal if we have any components of magnitude zero knocking around. It’ll come in handy later.
def find_zero_magnitudes(pcsets):
    components_with_zeroes = []

    for pcset in pcsets:
        decomp = fft(pcset)

        phases = np.angle(decomp)
        magnitudes = np.abs(decomp)

        # check components 0-6
        for x in range(7):
            if magnitudes[x] == 0:
                components_with_zeroes.append(x)

    return components_with_zeroes
find_zero_magnitudes(interesting)
[]
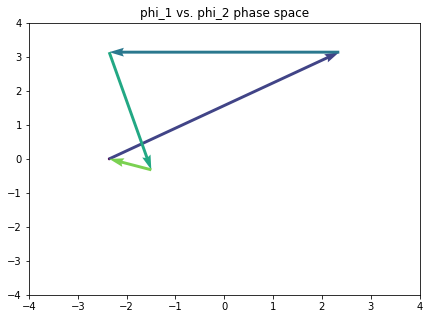
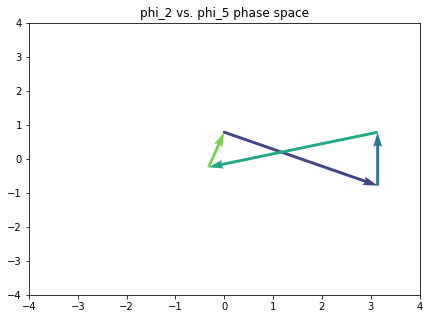
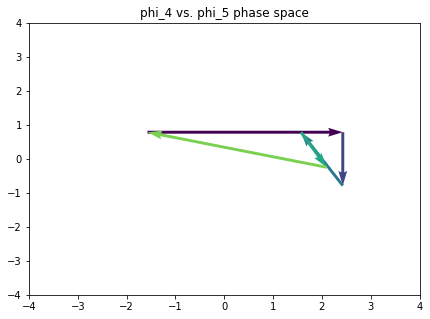
The point of all of this, of course, is analysis. We want to ask ourselves what a piece looks like in this space. So here’s a function that will plot a path through all the Fourier phase spaces, given a sequence of chords.
def path_in_all_phase_spaces(pcsets, phase_scope=[1, 2, 3, 4, 5, 6], c='black'):
    spaces = list(itertools.combinations(phase_scope,2))

    for space in spaces:
        xs = []
        ys = []

        x, y = space

        for pcset in pcsets:
            decomp = fft(pcset)
            phases = np.angle(decomp)
            xs.append(phases[x])
            ys.append(phases[y])

        xs = np.array(xs)
        ys = np.array(ys)

        plt.quiver(xs[:-1], ys[:-1],
                   xs[1:] - xs[:-1], ys[1:] - ys[:-1], np.array(range(len(xs))),
                   scale_units='xy', angles='xy', scale=1)
        plt.xlim(-4, 4)
        plt.ylim(-4, 4)
        plt.title('phi_{} vs. phi_{} phase space'.format(x, y))
        plt.show()
Here’s a tonal progression that touches on all the notes of the chromatic.
omnibus_strchord = ['C E G', 'G B D F', 'B- D F G#', 'F A D', 'A- D F B', 'C E G']
omnibus = [strchord_to_char(strchord) for strchord in omnibus_strchord]
We should use the code from before to check and see if we have any magnitude zero components the any of the phase spaces in which we are interested, before we start plotting our paths.
find_zero_magnitudes(omnibus)
[3, 6]
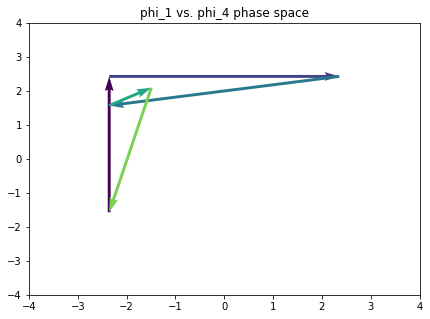
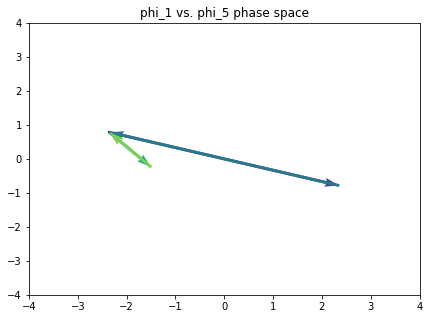
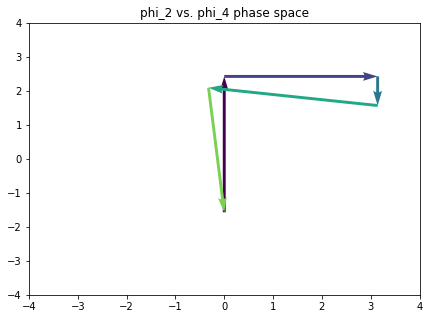
Bummer. Let’s avoid components 3 and 6 for the meantime.
plt.rcParams['figure.figsize'] = (7, 5)
path_in_all_phase_spaces(omnibus, phase_scope=[1, 2, 4, 5])