All I want for Christmas is a Buchmann-Meyer pattern
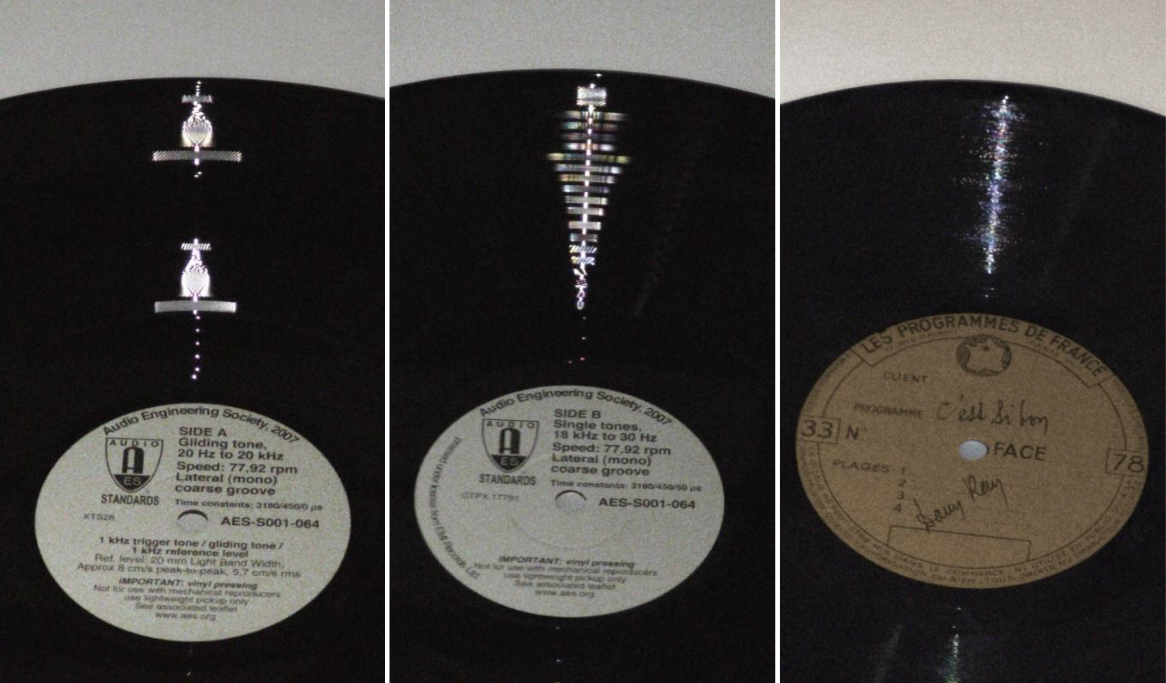
Doing some reading for my current project (a history of the CD Audio format), I stumbled across a physical phenomenon that does not often crop up in discussions of the history of gramophone recording: the Buchmann-Meyer effect. This optical effect was once used to measure the quality of gramophone records, both qualitatively and quantiatively, by shining a band of light on a disc and capturing the characteristic “Christmas tree”–like pattern that is reflected back to the viewer. If the pattern is clear and distinct, the record is in good nick; if the “branches” of the pattern are ill defined, the disc surface has perhaps become subject to wear and disintegration, or, indeed, was never fabricated to a high standard in the first place. In a figure from a very interesting recent paper—interesting for other reasons!—we see three discs.1 Visible are Buchmann-Meyer patterns reflected from the A and B sides of an Audio Engineering Society test record from 2007 (well defined) and one from an undated lacquer transcription disc, probably produced in France (not as well-defined).
Since I seek to understand both the (apparently) obvious and non-obvious differences between gramophone recording and digital optical media, such as the CD, it’s notable to me that the diagnostic use of this effect during the twentieth century exemplifies a practice not easily classified as one or the other: it is, after all, an optical technique used to assess a storage medium our interface to which is primarily tactile. Brian Rust defines the Buchmann-Meyer effect in the glossary to his Guide to Discography (1980) as follows:
These two German physicists [Buchmann and Meyer] discovered during experiments with sound recording in the 1920s that, if a beam of light is thrown onto a disc record, the grooves produce an effect suggesting the branches of a Christmas tree, with the root at the last groove. They further discovered that the length of the “branches” is in direct proportion to the amount sound recorded in that particular groove or grouping of grooves, and that the brightness and clarity of definition of the “branches” is also in direct ratio to the brightness and clarity of sound from the relative grooves.2
The effect was first described in a 1930 publication by Gerhard Buchmann and Erwin Meyer of the Berlin-based Heinrich-Hertz-Institut; Buchmann and Meyer’s research was translated into English a decade later and published in The Journal of the Acoustical Society of America (JASA).3 Unfortunately, both of these articles are not easily available: the latter article was omitted from online publication (unlike the vast majority of the rest of the JASA back catalog). Meyer’s method seemed to catch on. As J. Milton Cowan, the translator of Buchmann and Meyer’s original paper, noted in research presented to the Acoustical Society of America:
Buchmann and Meyer have shown that the optical patterns reflected from a modulated phonograph record can be evaluated quantitatively in terms of the stylus‐point velocity at the time of recording. If a record is illuminated with parallel rays of light, the width of the luminous band is directly proportional to the lateral velocity. Thus, the over‐all frequency‐response characteristic of a recording mechanism may be readily and quickly determined. Also, the characteristic of a reproducing system may be determined from a record of known lateral velocities at various frequencies. The effect may also be used to determine the magnitude of recording turntable speed fluctuations, surface noise level of a record, and the state of the division of the particles constituting the surface of a record.4
In other words, this optical technique could be used to measure the quality of a reproduction process with reference to a test disc containing known groove contents: say, the plain sine tones of the AES test disc shown above. The lateral velocity of the recording needle—how quickly the wavy groove makes the stylus wiggle in and out (along the hokey-cokey axis, not the rotational axis)—is an important characteristic of the recording process, since it determines both the dynamic range (the recorded difference between loudest and softest sound) as well as the effective frequency response (the media’s sensitivity to the most high-frequency content) of the recording apparatus.5 Pretty neat! There’s much more to say about the history of this technique, including about an extremely interesting BBC technical report that vastly improves engineers’ understanding of the effect, but that’s all I can muster for now. Happy holidays!
References
Buchmann, G., and E. Meyer. 1930. “Eine Neue Optische Meßmethode Für Grammophonplatten.” Electrische Nachtrichten-Technik 7 (4): 147–52.
———. 1941. “A New Optical Method of Measurement for Phonograph Recordings.” Translated by J. M. Cowan. The Journal of the Acoustical Society of America 12 (2): 303–6.
Chenot, Jean-Hugues, Louis Laborelli, and Jean-Étienne Noiré. “Saphir: Optical Playback of Damaged and Delaminated Analogue Audio Disc Records.” J. Comput. Cult. Herit. 11, no. 3 (August 2018): 14:1–14:29. https://doi.org/10.1145/3183505.
Cowan, Milton, and Paul Griffith. 1940. “Applications of the Buchmann‐Meyer Effect in the Calibration of Phonograph Recording and Reproducing Equipment.” The Journal of the Acoustical Society of America 11 (3): 380. https://doi.org/10.1121/1.1902165.
Guicking, Dieter. 2017. “Erwin Meyer – A Great German Acoustician: Biographical Notes.” [Drittes Physikalisches Institut der Universität Göttingen]. http://www.guicking.de/dieter/Erwin-Meyer-Eng.pdf.
Rust, Brian A. L. 1980. Brian Rust’s Guide to Discography. Discographies no.4. London: Greenwood Press.